Double-Ended Sales Closed About 2 Points Lower in Three LA Market Windows
Summary
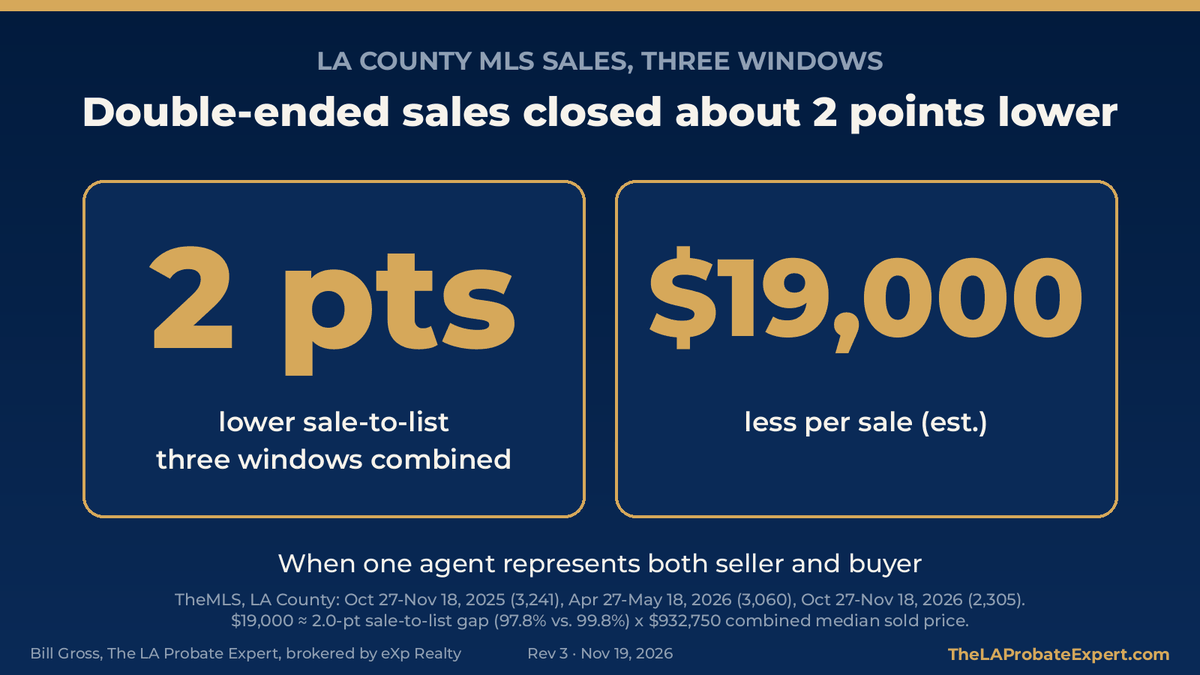
- Sale to list: in all three windows, double-ended sales closed about 2 points lower against list price. Fall 2025 (Oct 27 to Nov 18, 2025): 97.7% vs. 99.6%. Spring 2026 (Apr 27 to May 18, 2026): 98.4% vs. 100.2%. Fall 2026 (Oct 27 to Nov 18, 2026): 97.3% vs. 99.5%. Combined: 97.8% vs. 99.8%.
- Over list: double-ended sales went over list less often in every window, about a third less often combined. Fall 2025: 26.4% vs. 36.3%. Spring 2026: 27.3% vs. 40.4%. Fall 2026: 20.9% vs. 36.9%. Combined: 25.3% vs. 37.9%.
- Original list price: double-ended sales closed 1.9 points lower combined (96.1% vs. 98.0%), and 1.6 to 2.2 points lower in each window.
- In dollars: the 2-point gap is about $19,000 on the $932,750 combined median. A full 2.5% listing commission is about $23,300. The difference is ALMOST the ENTIRE commission.
- How often: double-ending was about 11% of sales in every window (360 of 3,241; 341 of 3,060; 249 of 2,305).
If you are selling a home in Los Angeles, ask one question before you sign a listing agreement: will you also represent the buyer?
When one agent represents both the seller and the buyer, it is called dual agency, or "double ending." The agent collects both sides of the commission. The seller, by the numbers, collects less.
What the LA County MLS data shows
We pulled every residential closed sale in Los Angeles County from TheMLS in three three-week windows: Oct 27 to Nov 18, 2025; Apr 27 to May 18, 2026; and Oct 27 to Nov 18, 2026. That covers single-family homes, condos and townhomes, and 2-4 unit buildings.
We kept the sales that had a real buyer's agent, and excluded tax-record and nonmember-buyer rows. The export has no agent ID, so we matched agents by name, email and cell phone. There is no overlap between the three pulls.
A few listings had obvious typos in the original list price, like $1,099 or $1.3 billion. So we left out any price ratio below 50% or above 200%. That is 27 ratios out of 8,606 sales. Those sales still count in the totals and the medians.
The fall 2025 window has 3,241 sales, with a $919,000 median sold price. The spring 2026 window has 3,060 sales, with a $960,000 median. The fall 2026 window has 2,305 sales, with a $925,000 median. Combined, that is 8,606 sales, with a $932,750 median sold price.
| Window | Sales | Double-ended | Sale/list, one agent | Sale/list, two agents | Over list, one agent | Over list, two agents | Original-list gap |
|---|---|---|---|---|---|---|---|
| Fall 2025 (Oct 27 to Nov 18, 2025) | 3,241 | 360 (11.1%) | 97.7% | 99.6% | 26.4% | 36.3% | 1.9 pts |
| Spring 2026 (Apr 27 to May 18, 2026) | 3,060 | 341 (11.1%) | 98.4% | 100.2% | 27.3% | 40.4% | 1.6 pts |
| Fall 2026 (Oct 27 to Nov 18, 2026) | 2,305 | 249 (10.8%) | 97.3% | 99.5% | 20.9% | 36.9% | 2.2 pts |
| All three combined | 8,606 | 950 (11.0%) | 97.8% | 99.8% | 25.3% | 37.9% | 1.9 pts |
The sale-to-list gap, the over-list gap and the original-list gap showed up in every window.
These are three short windows, not a full year, and this is a correlation, not proof of cause. Read the numbers as directional.
All three windows, by group
| Group | Sales | Median sold price | Avg sale/list | Median sale/list | Avg sale/original list | Closed over list |
|---|---|---|---|---|---|---|
| One agent (double-ended) | 950 | $928,500 | 97.8% | 98.6% | 96.1% | 25.3% |
| Same office, different agent | 590 | $1,230,000 | 101.2% | 100.0% | 99.9% | 42.5% |
| Different offices | 7,066 | $920,000 | 99.6% | 100.0% | 97.8% | 37.5% |
| Two agents combined | 7,656 | $935,000 | 99.8% | 100.0% | 98.0% | 37.9% |
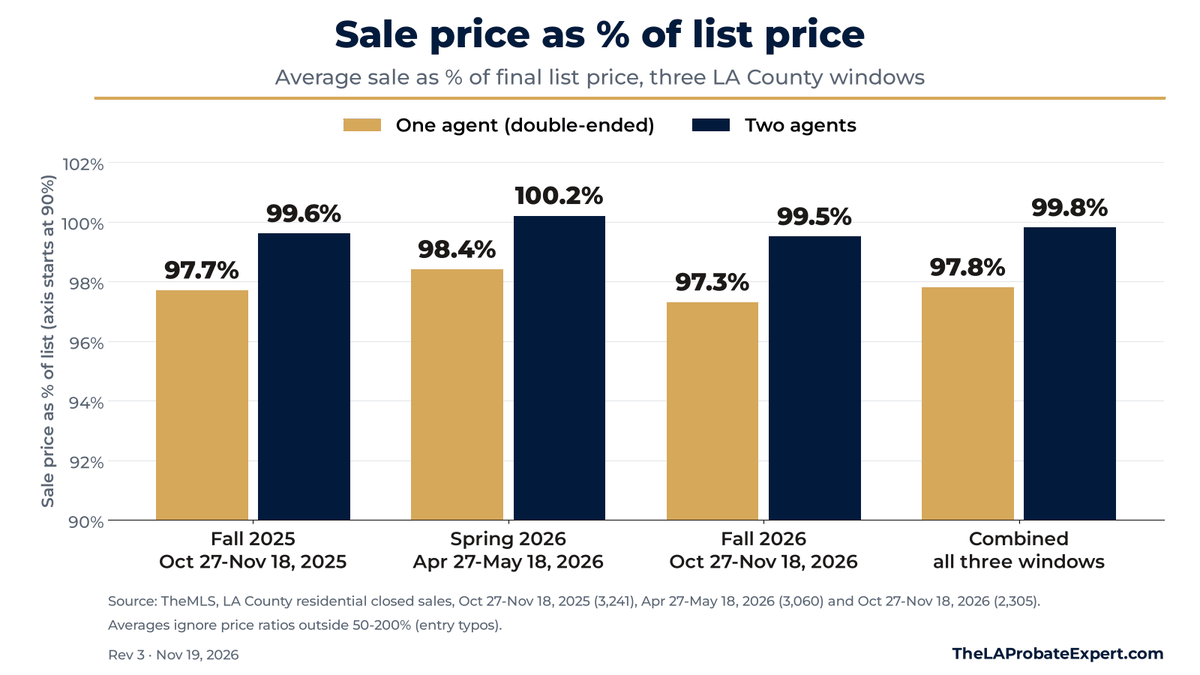
Against the final list price, double-ended sales averaged 97.8%. Sales with two agents averaged 99.8%. That is a gap of 2.0 points. By window, it was 1.9 points in fall 2025, 1.8 points in spring 2026 and 2.2 points in fall 2026.
Against the original list price, double-ended sales averaged 96.1%, vs. 98.0% with two agents. That is a gap of 1.9 points. By window, it was 1.9, 1.6 and 2.2 points.
Original list price matters because it is where the seller started. Price cuts along the way are money the seller did not get.
The median sold price differs by group mostly because of which price range the homes were in. The percentages are the better measure.
Less competition for the home
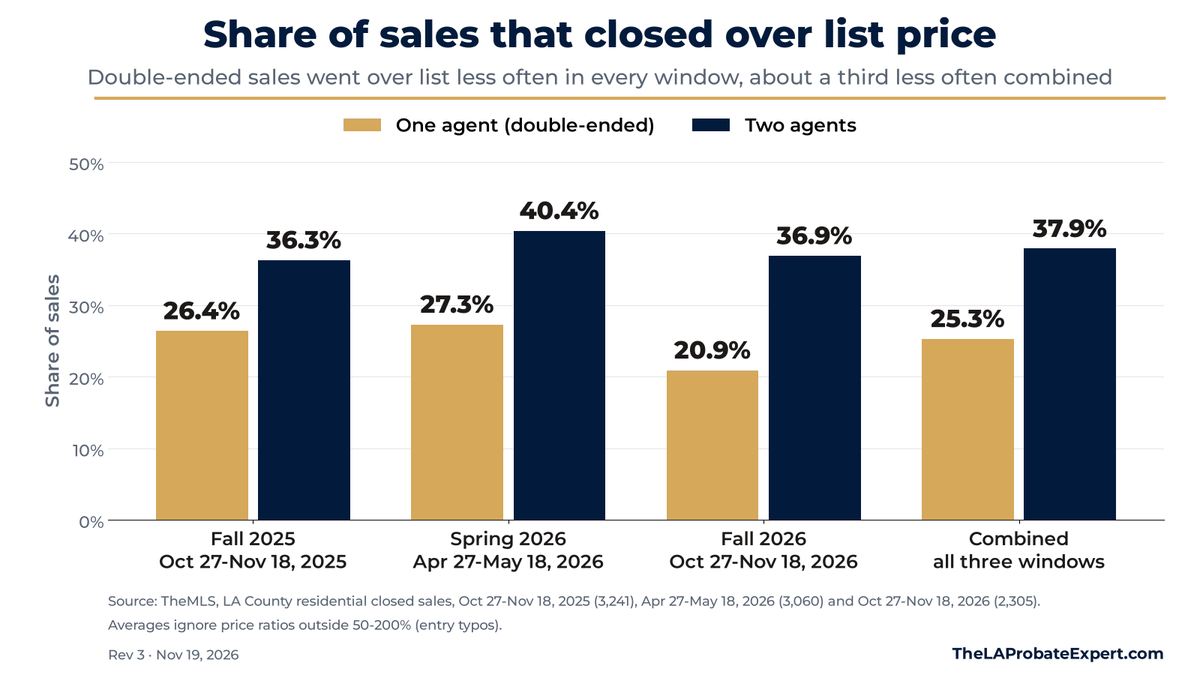
In every window, double-ended sales went over list less often.
In fall 2025, 26.4% of double-ended sales closed over list price, vs. 36.3% with two agents. In spring 2026, it was 27.3% vs. 40.4%. In fall 2026, 20.9% vs. 36.9%. Combined, 25.3% vs. 37.9%, about a third less often.
Over-list sales usually mean more than one buyer wanted the home. When one agent handles both sides, that competition shows up less often.
What the gap means in dollars
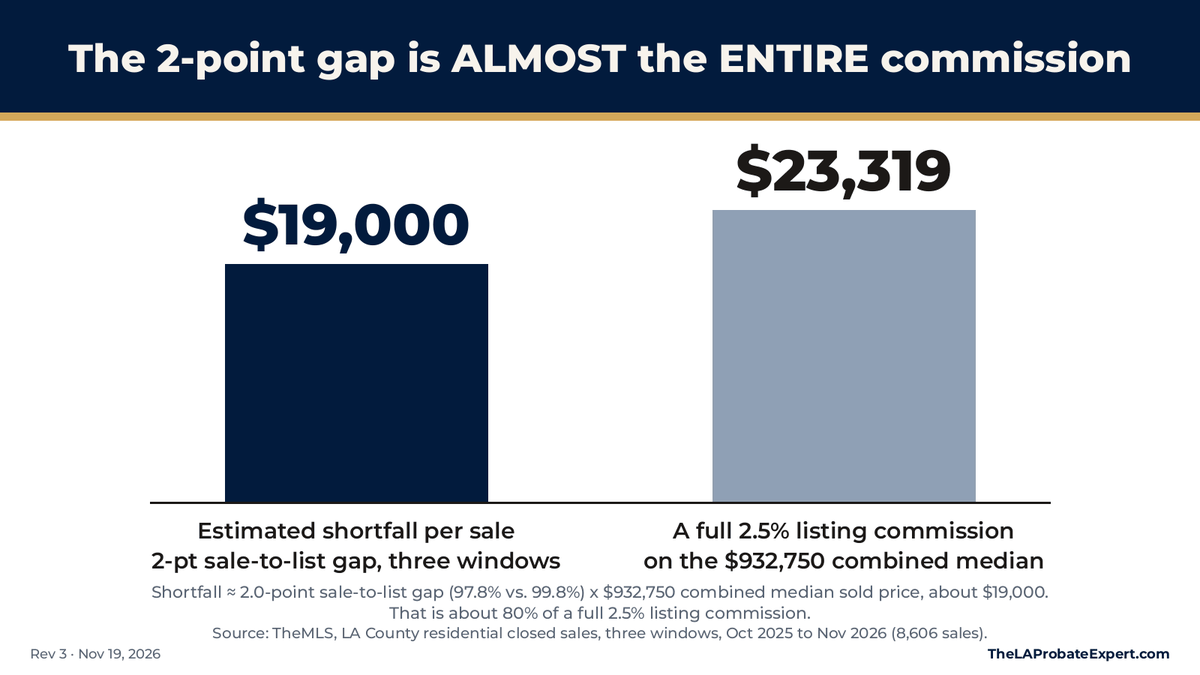
The 2-point sale-to-list gap is about $19,000 per sale on the $932,750 combined median. That is about $20,000 per $1 million of price.
A full 2.5% listing commission on that median is about $23,300. The difference in price is ALMOST the ENTIRE commission.
Against original list price, the 1.9-point gap is about $18,000 on the same median.
This is a correlation in three three-week samples, so read it as directional, not proof of cause.
Why this happens
When one agent represents both sides, the conflict is built in. The seller wants the highest price. The buyer wants the lowest. One person cannot push hard for both.
There is also less reason to keep marketing. If the listing agent already has a buyer in hand, the drive to bring in a second or third offer goes down. Fewer offers means less competition, and less competition usually means a lower price.
Look at the same-office row. Two different agents from the same office did just fine in all three windows: 101.2% of final list price combined. The weaker results showed up when one agent sat on both sides of the deal.
What to ask before you list
Before you hire a listing agent, ask:
- Will you represent the buyer on my home?
- How will you market it to every buyer's agent in Los Angeles?
- How will you handle multiple offers?
My practice
It is my practice NOT to represent buyers on my own listings.
I represent the seller. Every buyer comes in with their own agent, and I negotiate only for the seller. With 40 years in real estate and lending, I believe that is how the seller gets the best result.
FAQ
Is the gap against the original list price or the final list price?
Both. Against the final list price, the gap is about 2 points (97.8% vs. 99.8% combined), and it showed up in all three windows. Against original list price, the gap was 1.9 points combined (96.1% vs. 98.0%), and 1.6 to 2.2 points in each window.
How much does the 2-point gap cost a seller?
About $19,000 on the $932,750 combined median sold price. A full 2.5% listing commission on that median is about $23,300, so the difference is ALMOST the ENTIRE commission.
What if the buyer's agent is from the same office as the listing agent?
In all three windows, same-office sales with different agents did as well as, or better than, the different-offices group (101.2% of final list price combined, vs. 99.6%). The lower results showed up when one agent handled both sides.
How often did double-ended homes sell over list price?
Less often than two-agent sales in every window, about a third less often combined. Fall 2025: 26.4% vs. 36.3%. Spring 2026: 27.3% vs. 40.4%. Fall 2026: 20.9% vs. 36.9%. Combined: 25.3% vs. 37.9%.
How common is double ending?
About 11% of the sales in every window: 360 of 3,241 in fall 2025, 341 of 3,060 in spring 2026, and 249 of 2,305 in fall 2026.
Thinking about selling? Talk to me first
If you are selling a home in Los Angeles, talk to me before you sign a listing agreement. I will walk you through your home, your options, and how to get the highest price.
Please let me know if I can help in ANY way.