How’s the Real Estate Market Really? The Raw Data Behind the Headlines
A look at prices, mortgage rates, and inventory—and what they mean for homeowners and attorneys handling property sales.

Every single week, mainstream media outlets, cable television pundits, and corporate tech portals dump a fresh wave of panic, hyperbole, and conflicting statistics on American buyers and sellers. One headline claims home prices are "poised to crash," while the very next article warns that housing is permanently unaffordable. If you make real estate decisions based on clickbait headlines, you will end up trapped in analysis paralysis. To navigate this market successfully, you have to cut through the corporate marketing hype, look at raw economic data from first principles, and put the numbers in proper historical context. Here is the complete, point-by-point data driven review of today's housing market.
1. The General Economy: What the Dashboard Metrics Actually Mean
Before looking at real estate directly, we have to inspect the broader macroeconomic backdrop. Here is where the general economy stands according to official U.S. Census Bureau, Bureau of Labor Statistics (BLS), and Bureau of Economic Analysis (BEA) metrics:
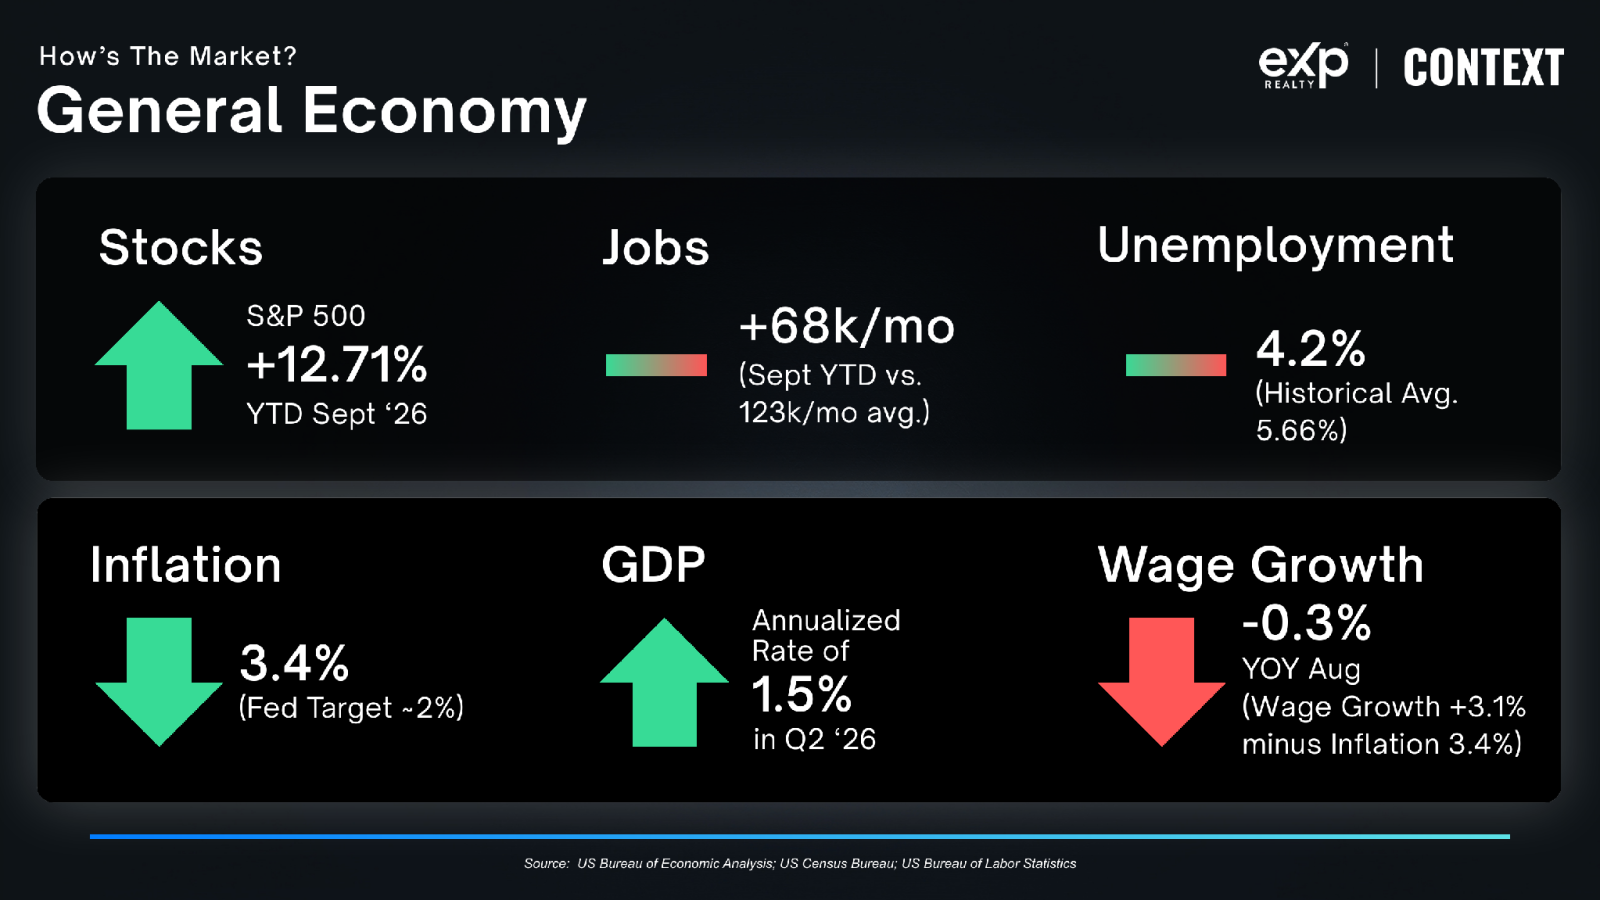
The media loves to celebrate stock market record highs and low unemployment numbers, but look at the bottom right corner of that dashboard: Real Wage Growth is negative (-0.3%). While nominal paychecks grew 3.1%, inflation ate up 3.4%. That means the average American family is losing real purchasing power every single month despite high-sounding economic propaganda.
2. Existing Homes vs. New Homes: Two Completely Different Markets
One of the biggest mistakes consumers and part-time agents make is lumping resale properties together with brand-new construction. The raw data shows these two segments are operating under completely different conditions:
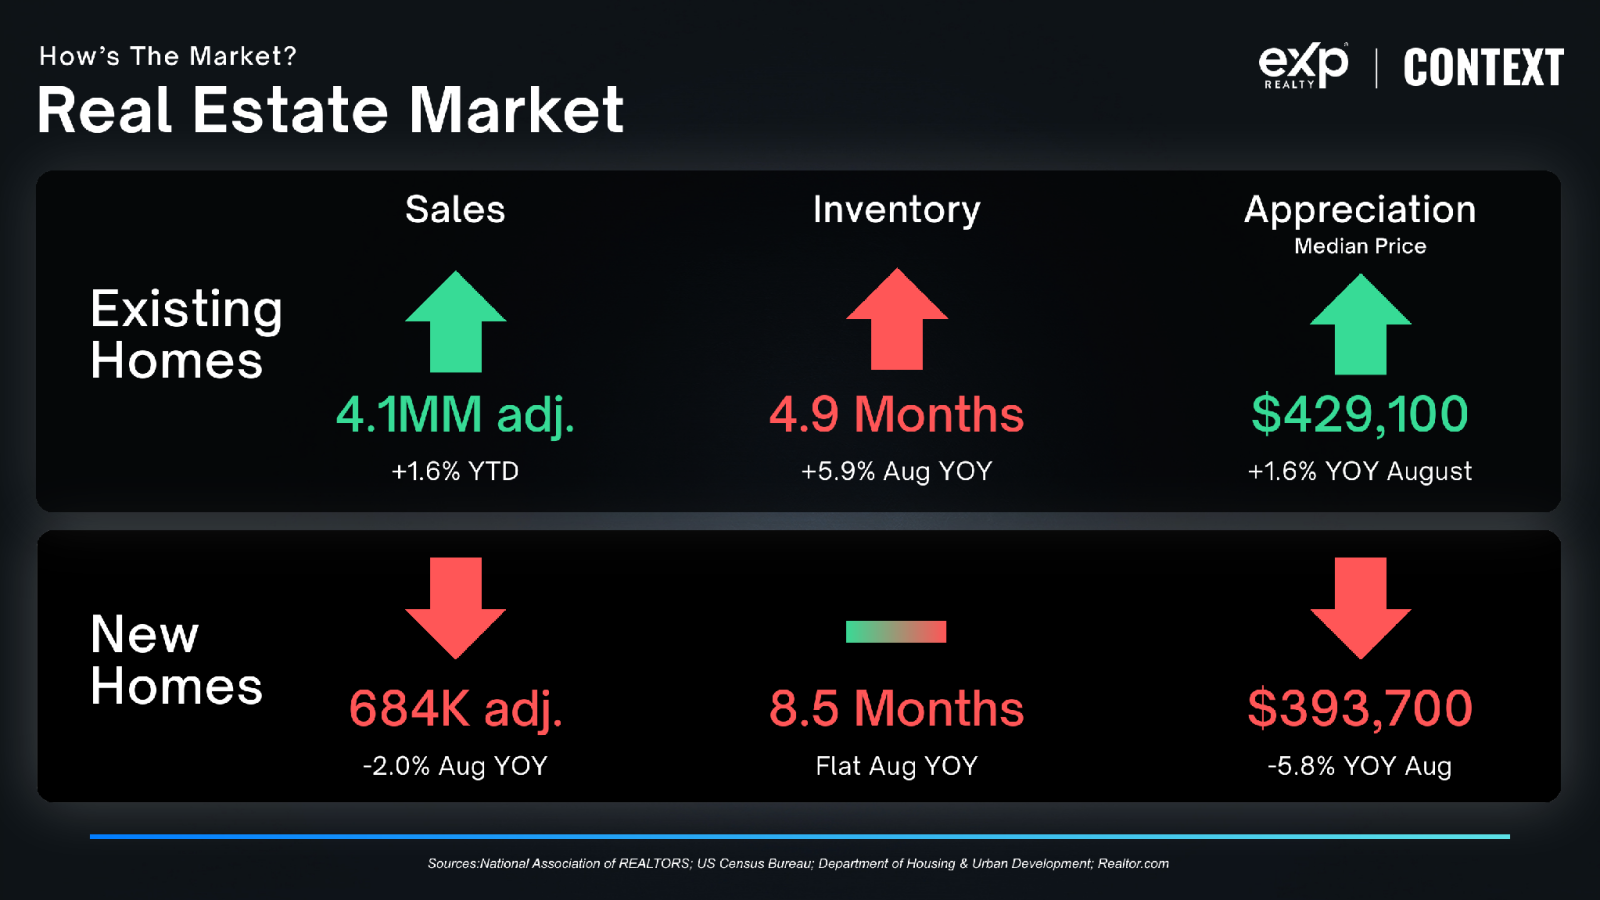
Notice the stark divergence: homebuilders hold 8.5 months of inventory and have lowered their median price to $393,700 by offering rate buydowns and floorplan adjustments. Meanwhile, existing single-family resale homes remain tight at 4.9 months of supply with median prices holding firm at $429,100.
3. Existing Home Sales vs. Population: The Long-Term Demographic Truth
To understand why home transaction volumes feel slow, you have to step back 45 years.
In 1980, the U.S. population was roughly 226 million people, and annual existing-home sales hovered around 3 million to 4 million transactions. By 2026, the U.S. population expanded past 340 million people.
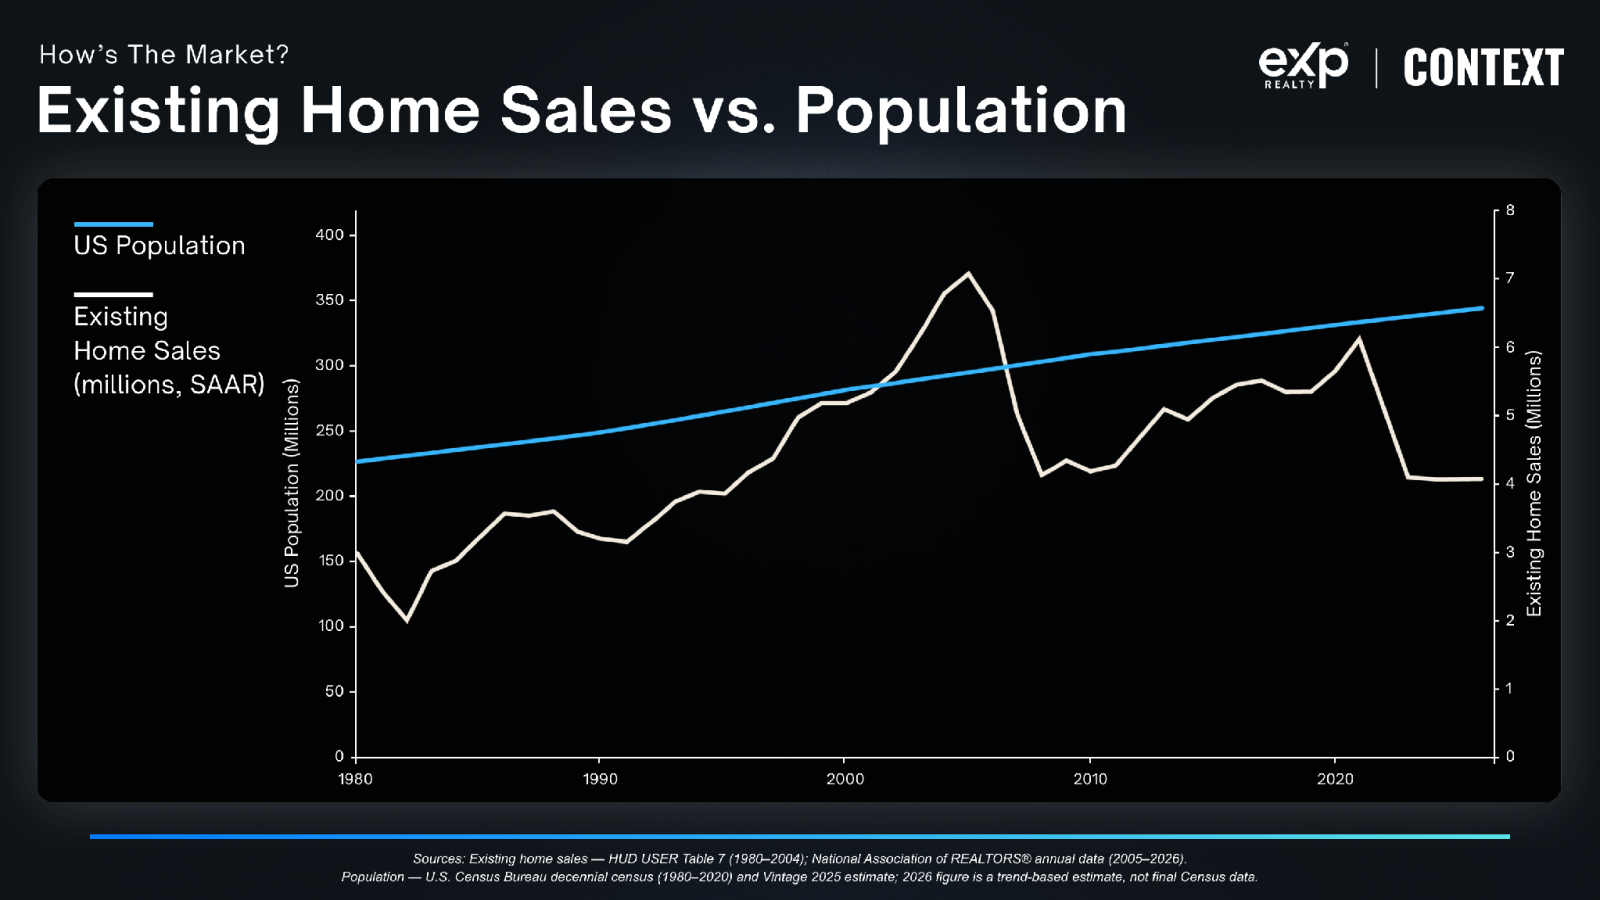
Yet annual existing-home sales sit at just 4.1 million units. Per capita, transaction volume is near historical multi-decade lows. The problem isn't that Americans don't want to own homes—it's that a chronic lack of listing inventory has artificially constrained transaction velocity.
4. Home Prices Across Metro Markets: Why National Averages Lie
Is the national housing market crashing? The data says absolutely not.
When analyzing the 300 largest metropolitan housing markets across the United States:
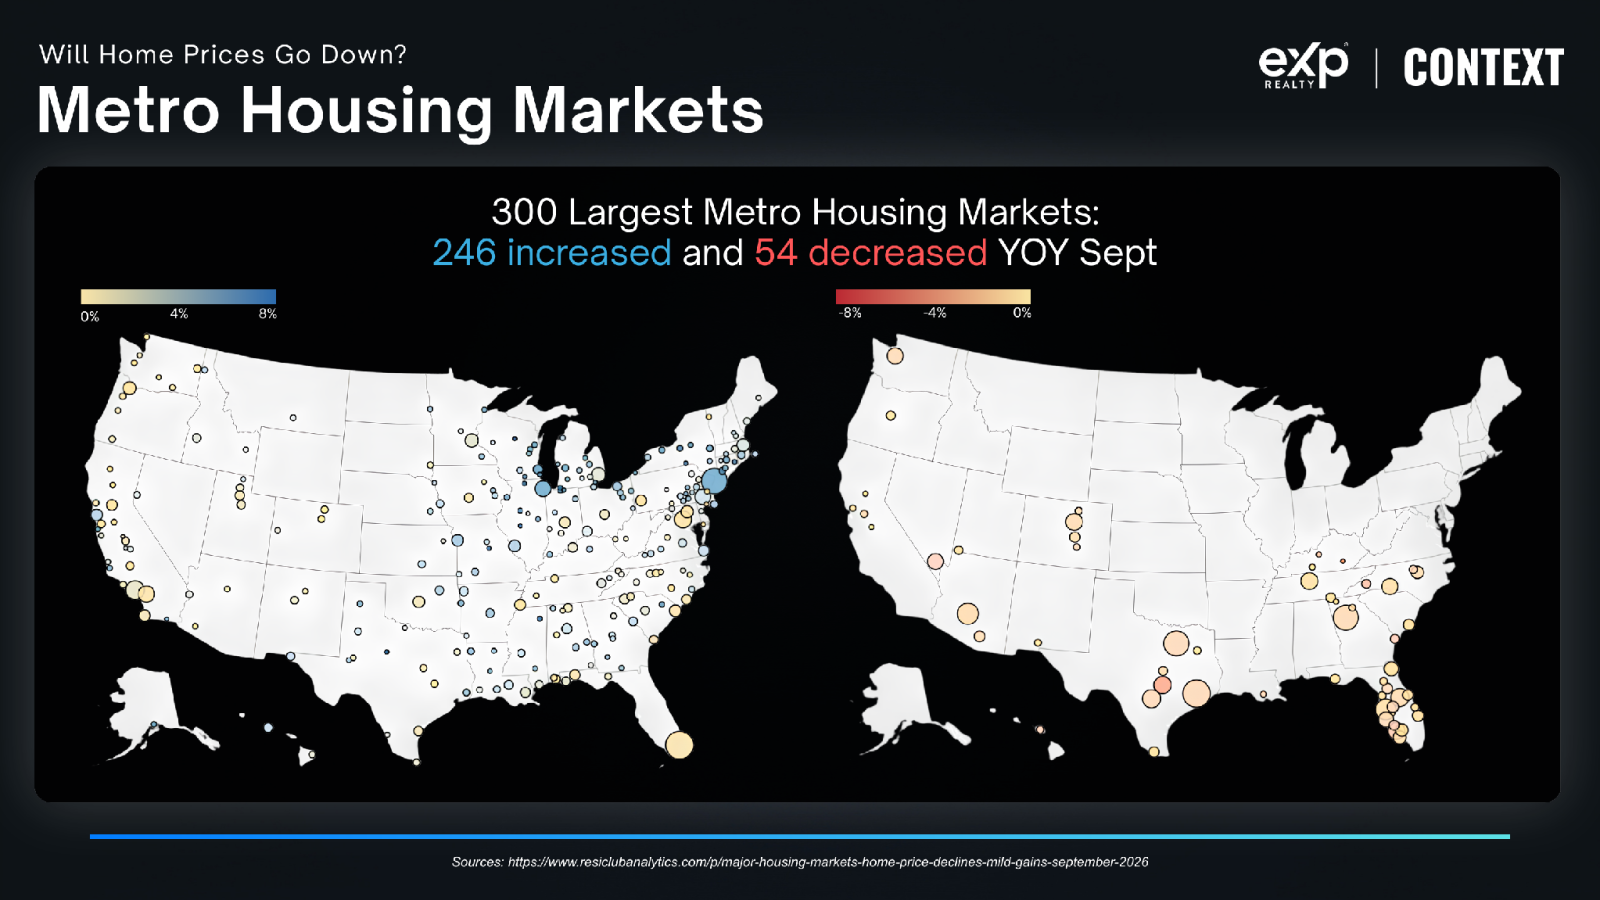
The minor price corrections are heavily localized in select overbuilt Sunbelt markets and specific West Coast metro pockets, while over four-fifths of the country continues to appreciate.
5. Inventory and Local Market Conditions: Supply Is Unevenly Distributed
Nationwide listing inventory grew by +5.9% year-over-year (compared to a massive +28.9% surge the prior year). But supply shifts are highly unequal:
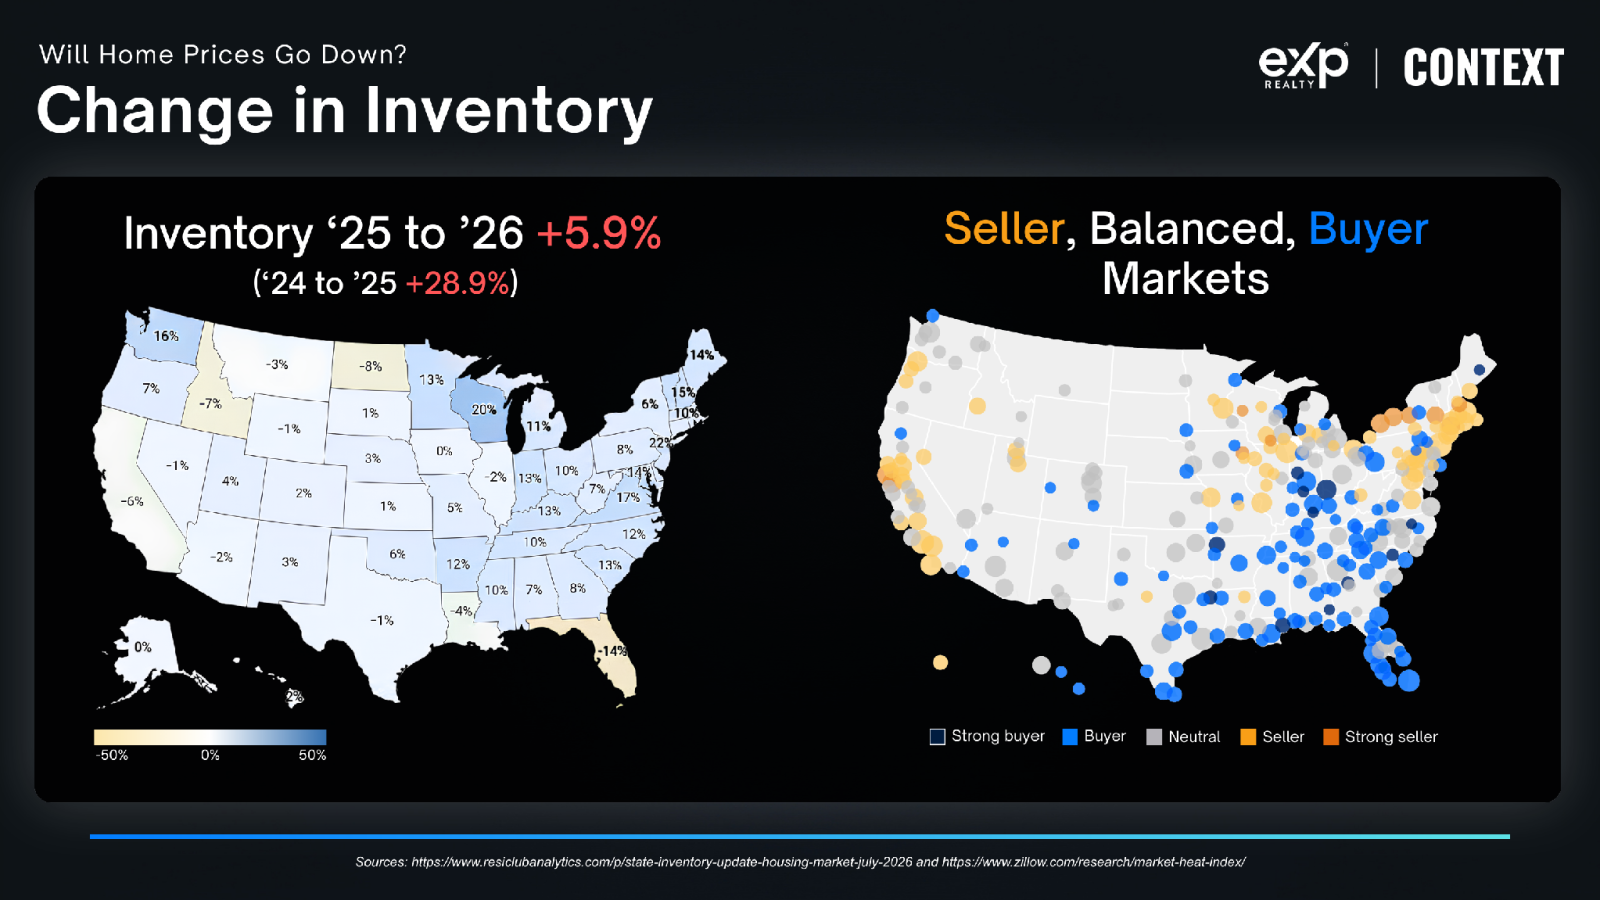
Because inventory expansion is so patchy, trying to apply a national headline to your local neighborhood is a recipe for financial disaster.
6. Mortgage Rates in Historical Context: Anchored to the Anomaly
Borrowers today complain bitterly about 6.5% to 7.28% mortgage rates. But let's look at the 50-year Freddie Mac historical chart:
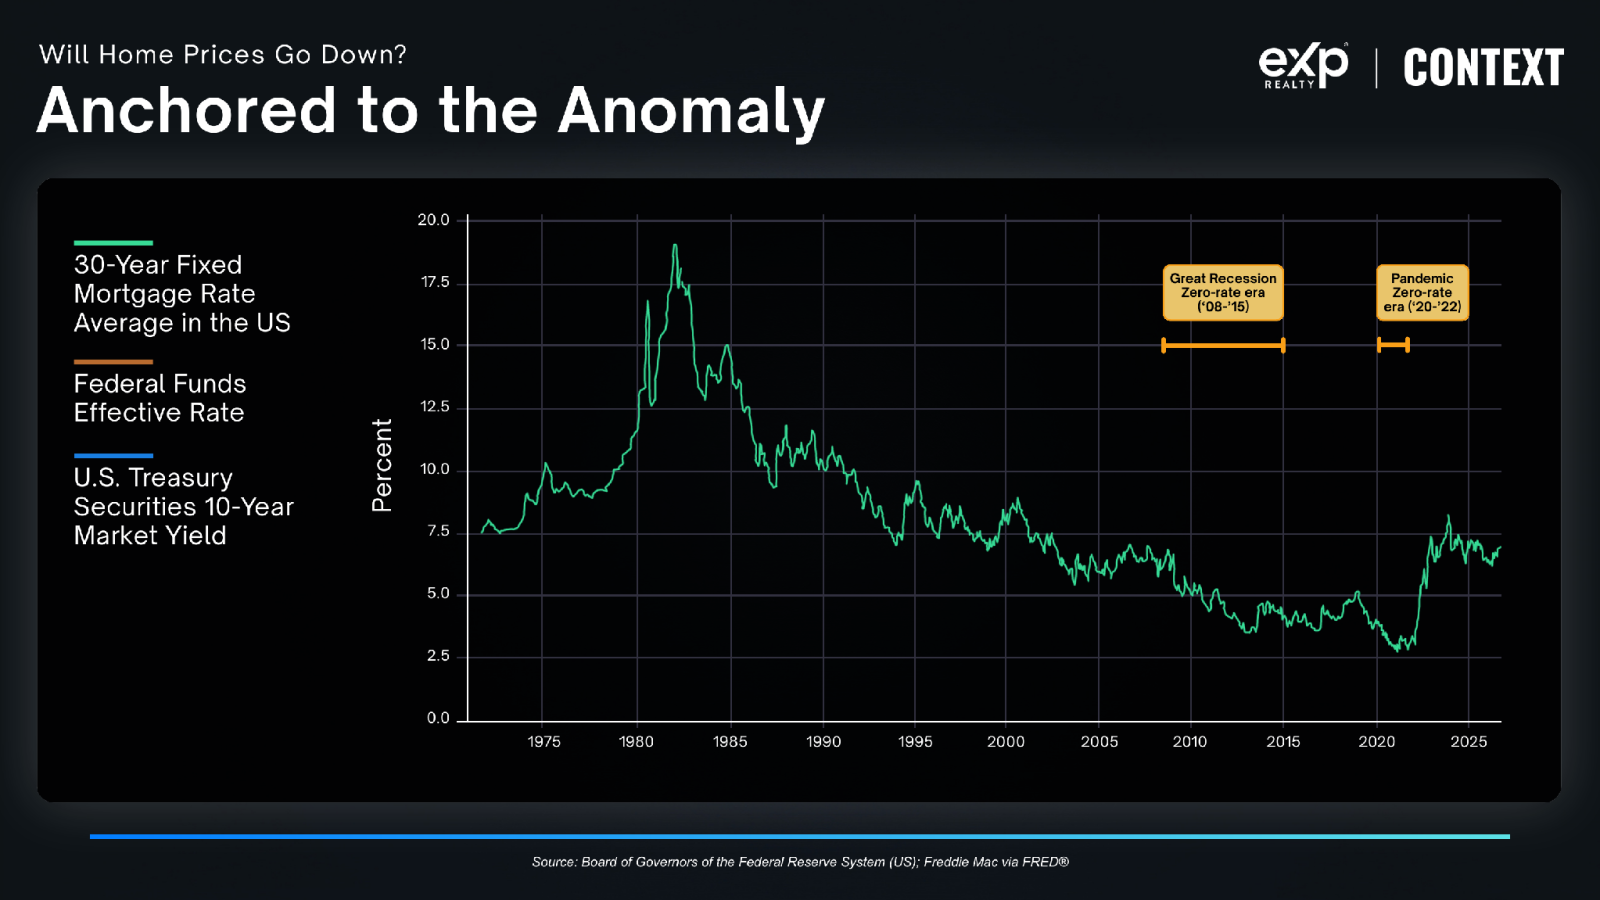
Consumers are currently "anchored to an anomaly." The sub-3% borrowing costs of 2020–2021 were an emergency statistical aberration. Today's 6.5%–7.2% range represents a return to standard historical norms.
7. Mortgage Rates and the Federal Reserve Policy
Why haven't mortgage rates dropped drastically? Because consumers misinterpret what drives them.
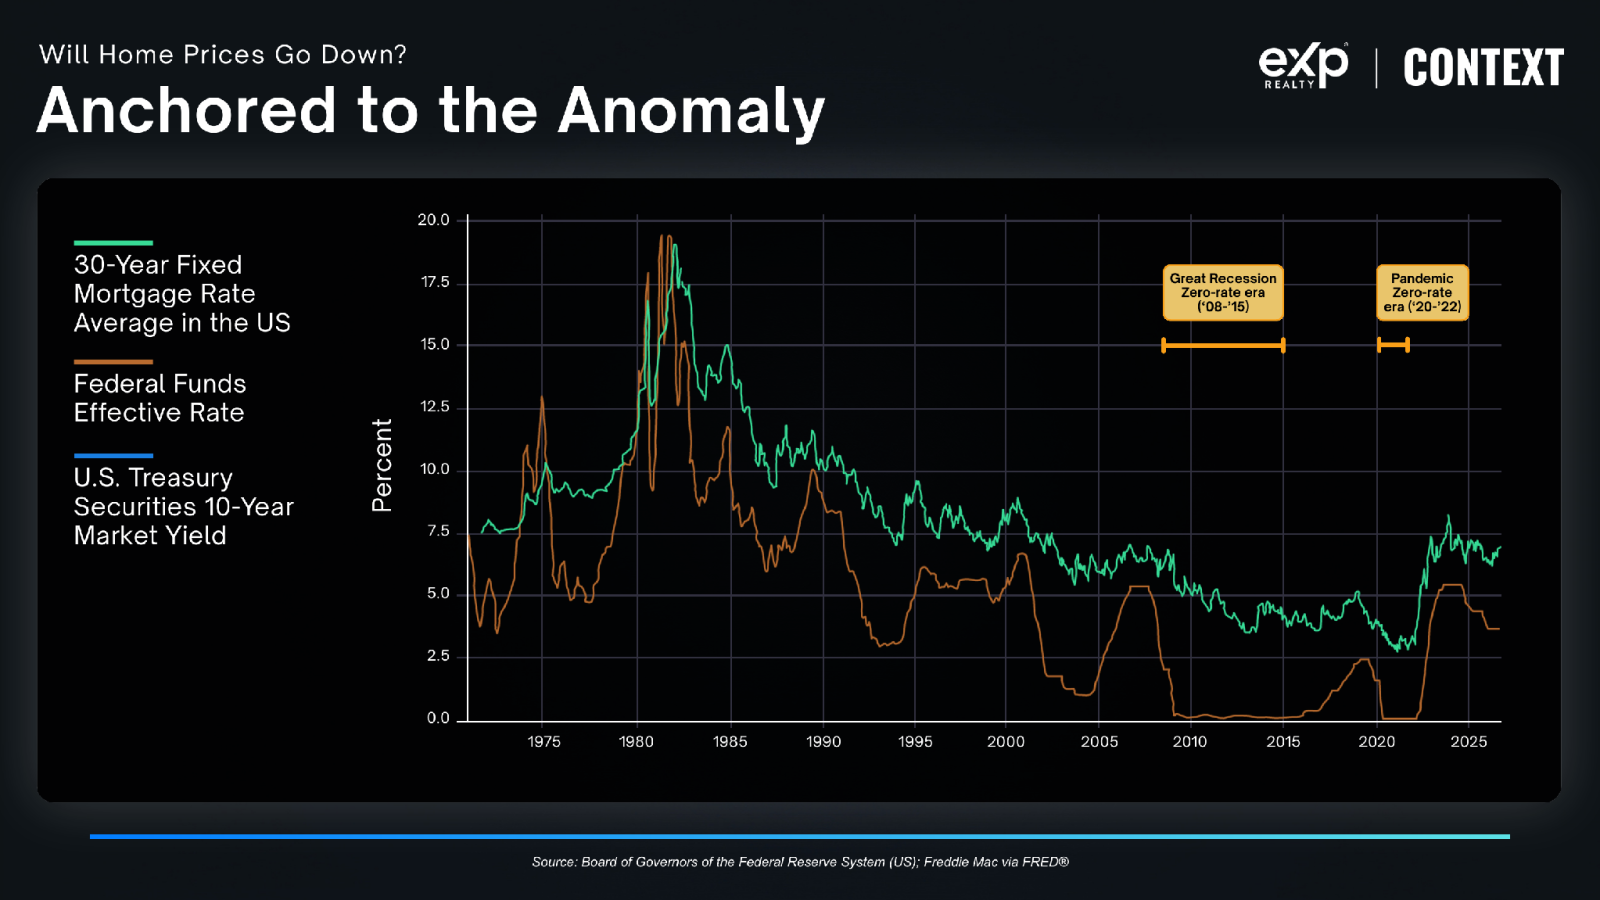
Mortgage rates do NOT follow short-term Federal Reserve rate hikes or cuts directly. The Fed controls short-term overnight lending rates between banks, but long-term fixed mortgage rates move independently based on broader bond market expectations.
8. The 10-Year Treasury Yield and the $40 Trillion Debt Spiral
Instead of the Fed, 30-year fixed home loans track the 10-Year U.S. Treasury yield plus a historical risk spread.
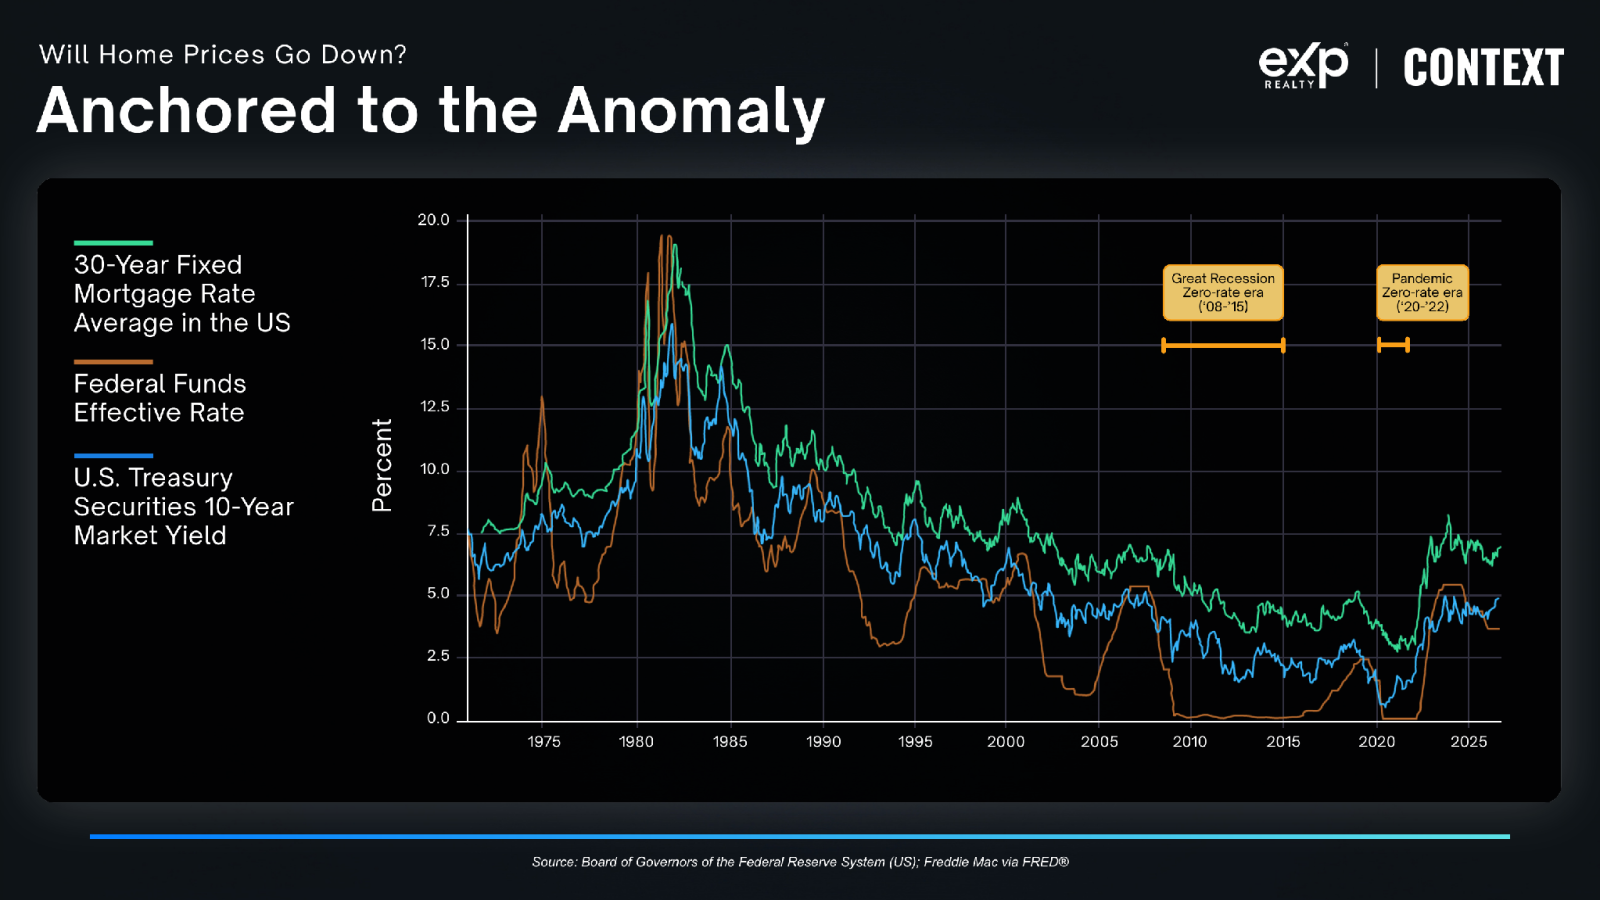
When the federal government runs a $1.79 trillion to $2.46 trillion annual budget deficit and national debt surges past $40 trillion, the Treasury is forced to flood the bond market with new debt. Bond investors demand higher yields to absorb that paper, which directly keeps 10-Year Treasury yields up and pulls 30-year mortgage rates right along with them.
9. Buying Now vs. Waiting for Lower Rates: The Math of Waiting
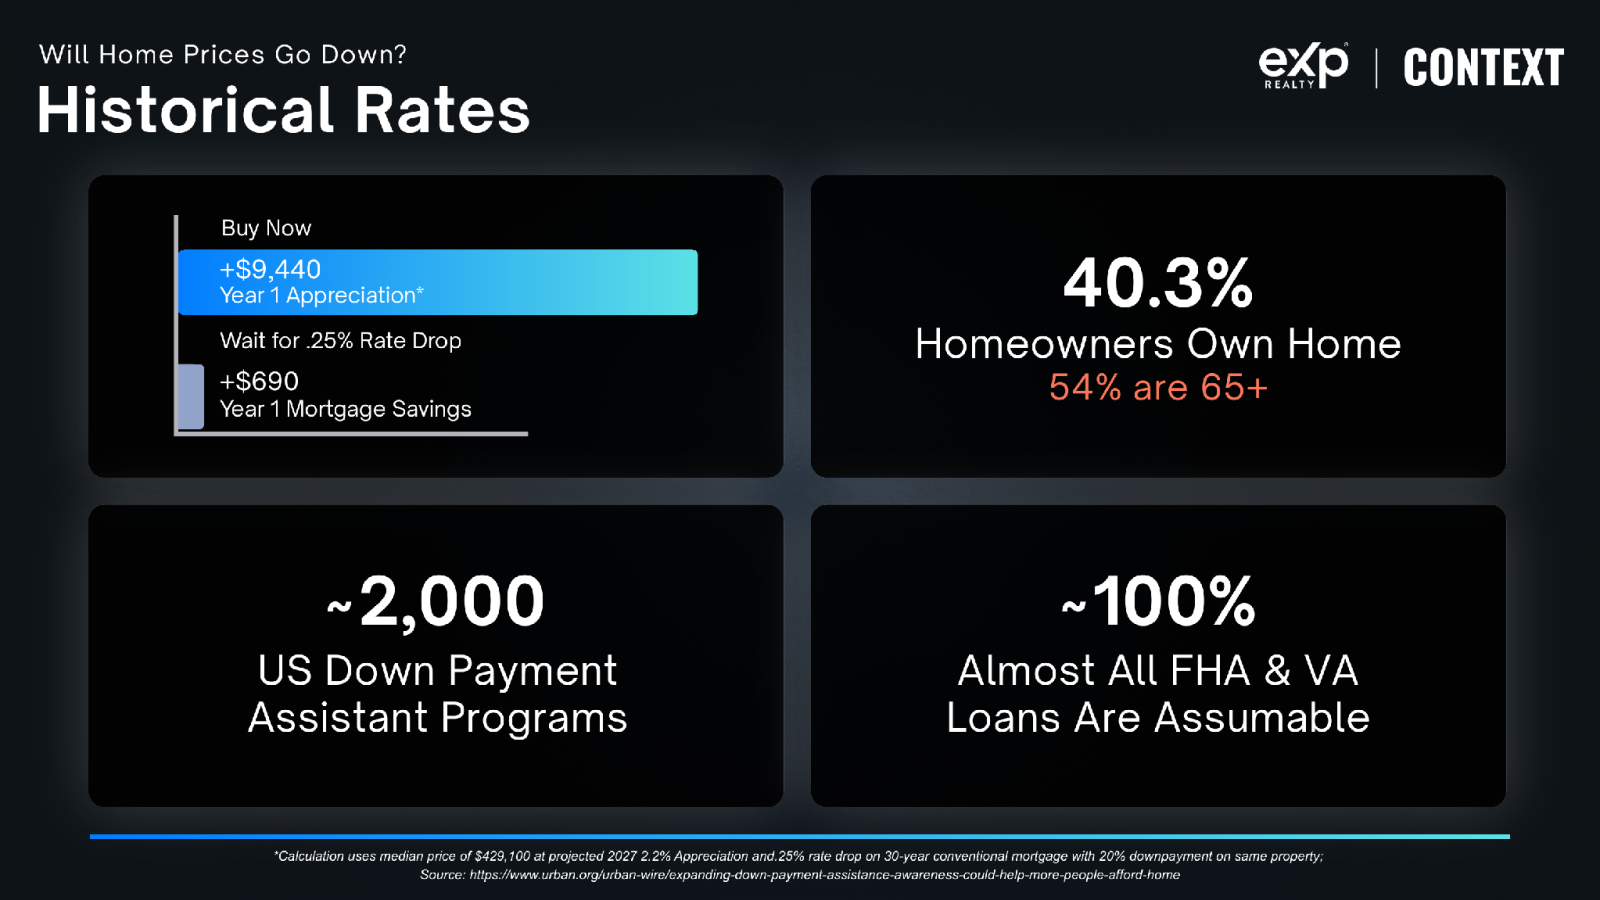
Many prospective buyers declare: "I'm going to wait on the sidelines until rates drop a quarter point." Let's run the exact mathematical scenario on a median $429,100 home:
Furthermore, buyers have tools available today:
- Down Payment Assistance: Over 2,000 active programs exist across the U.S..
- Assumable Mortgages: Almost 100% of FHA and VA loans are legally assumable at their original low interest rates.
- Outright Ownership: 40.3% of U.S. homeowners own their homes with zero mortgage debt (54% of whom are 65+).
10. Generational Homeownership & The Rate Lock-In Trap
Why is inventory so tight? Look at the breakdown of existing outstanding mortgages by interest rate:
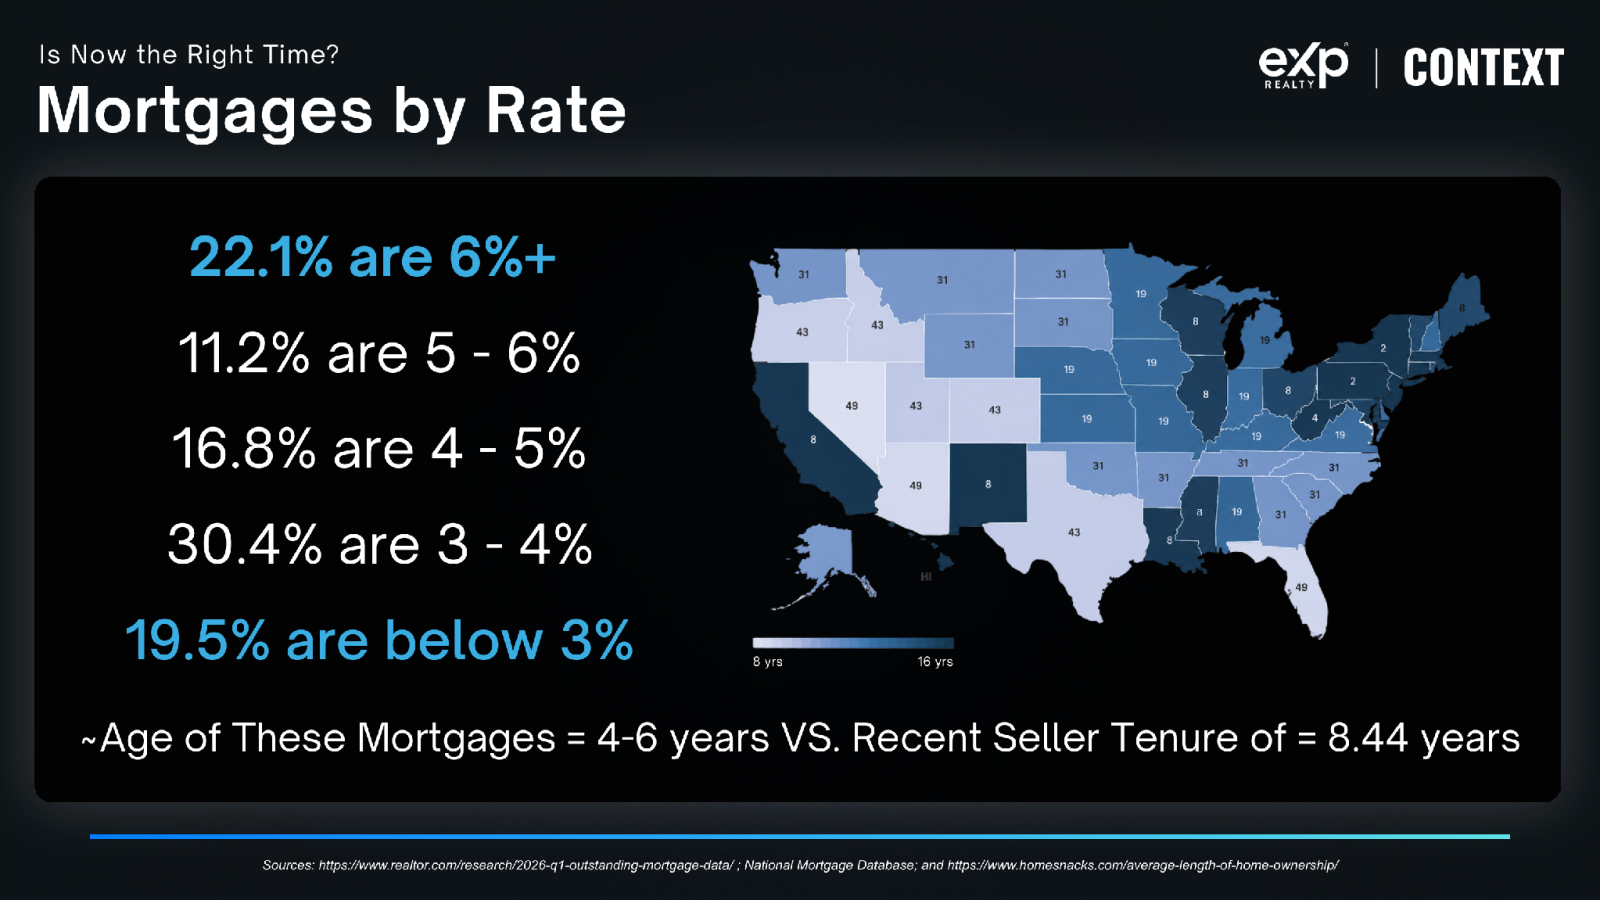
Nearly 50% of all mortgages in America sit below 4%. With the average tenure of recent home sellers sitting at 8.44 years (compared to mortgage ages averaging 4 to 6 years), tens of millions of homeowners are financially locked into their current homes. They refuse to trade a 3% mortgage for a 7% loan unless life forces a move.
12. Homeowners vs. Investors: The Buy vs. Rent Reality
Let's look at the financial math comparing buying versus renting over a 12-month period:
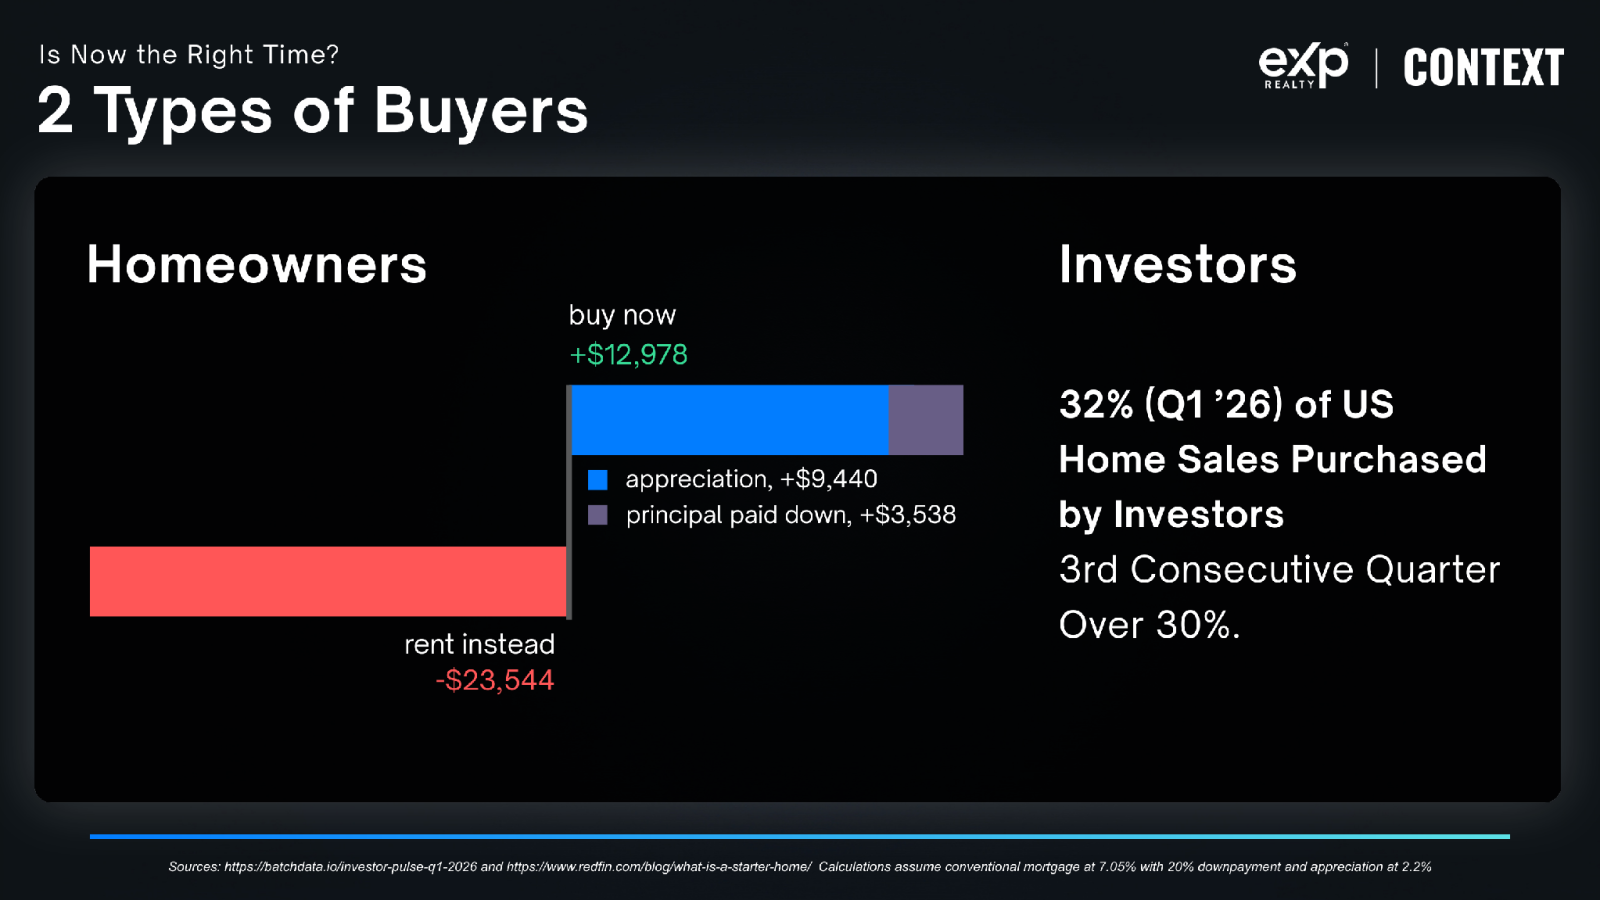
Smart capital understands this math. In Q1 2026, investors bought 32% of all U.S. home sales—marking the 3rd consecutive quarter where investors captured over 30% of total transaction volume. While portal algorithms preach "be happy renting," institutional investors are buying up single-family real estate as fast as they can.
13. REALTOR® Membership vs. Transactions per Member
In 1975, the National Association of Realtors® had roughly 400,000 members, and the average agent completed 12 to 15 transaction sides per year.
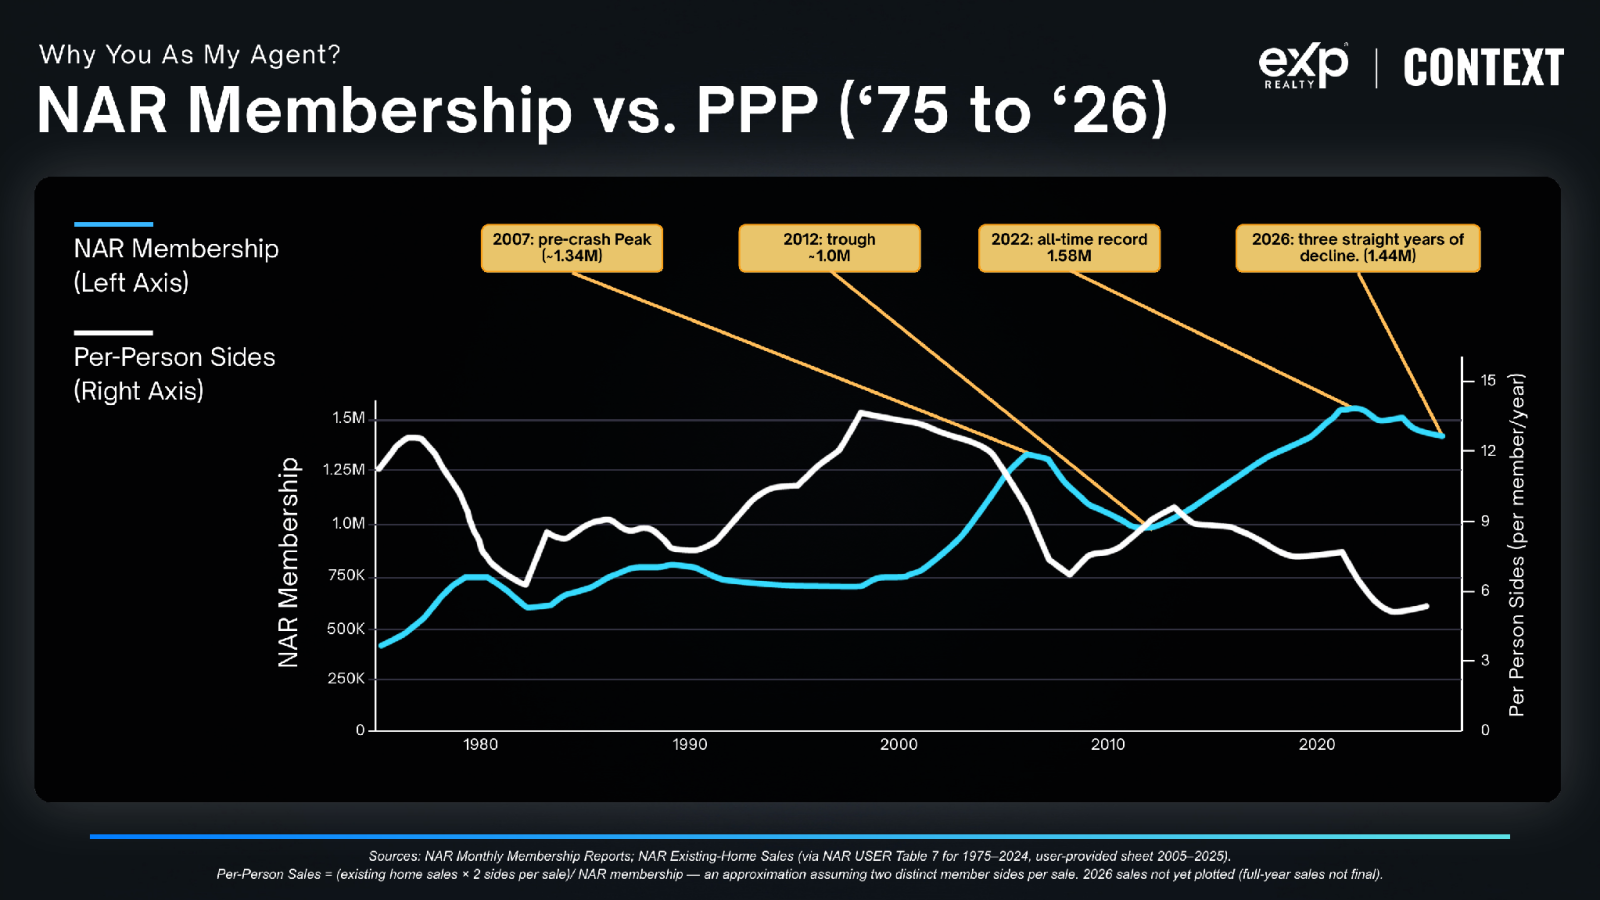
Today, NAR membership sits near 1.5 million agents, but existing sales volume has contracted. As a result, the average agent completes only 3 to 4 transactions per year.
In a complex, high-interest-rate environment, relying on a part-time agent who handles 3 deals a year is a dangerous financial gamble. You need a battle-tested professional who analyzes real-time market data every day. Part of why the real estate industry news is so bad is it is written for the 1 million real estate agents, the majority of whom are not doing much business.
The Bottom Line
Don't let sensational headlines or biased algorithms talk you out of the American Dream. The fundamental laws of real estate have not changed: supply remains low, investor demand is high, and homeownership remains the premier vehicle for building long-term family wealth. If you want to build a clear, data-driven real estate strategy tailored to your specific goals, contact me directly and let’s put a plan together.
Let's take a look at the news from this week.
My weekly overview of the housing market always starts with a look at the key demand and supply factors fundamental in any economy. The driver of demand is interest rates, and supply is measured by the homes for sale.
This week mortgage rates fell for the 2nd consecutive week about a tenth of a percent, closing at 7.37% down from last week’s 7.48%.
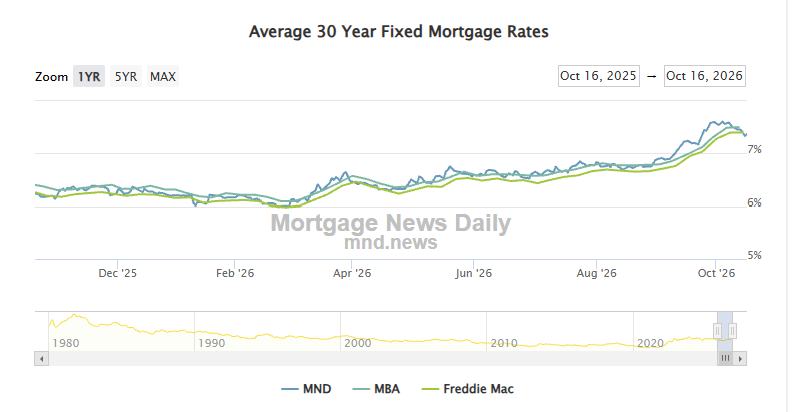
These rates, while causing pain for home builders and 1st time buyers, have not and will not significantly slow purchases as the smaller percentage of the population that can afford to buy a home is doing well.
On the supply side, inventory grew in September to exceed last year's rate by about 2% or almost 21,000 more homes for sale.
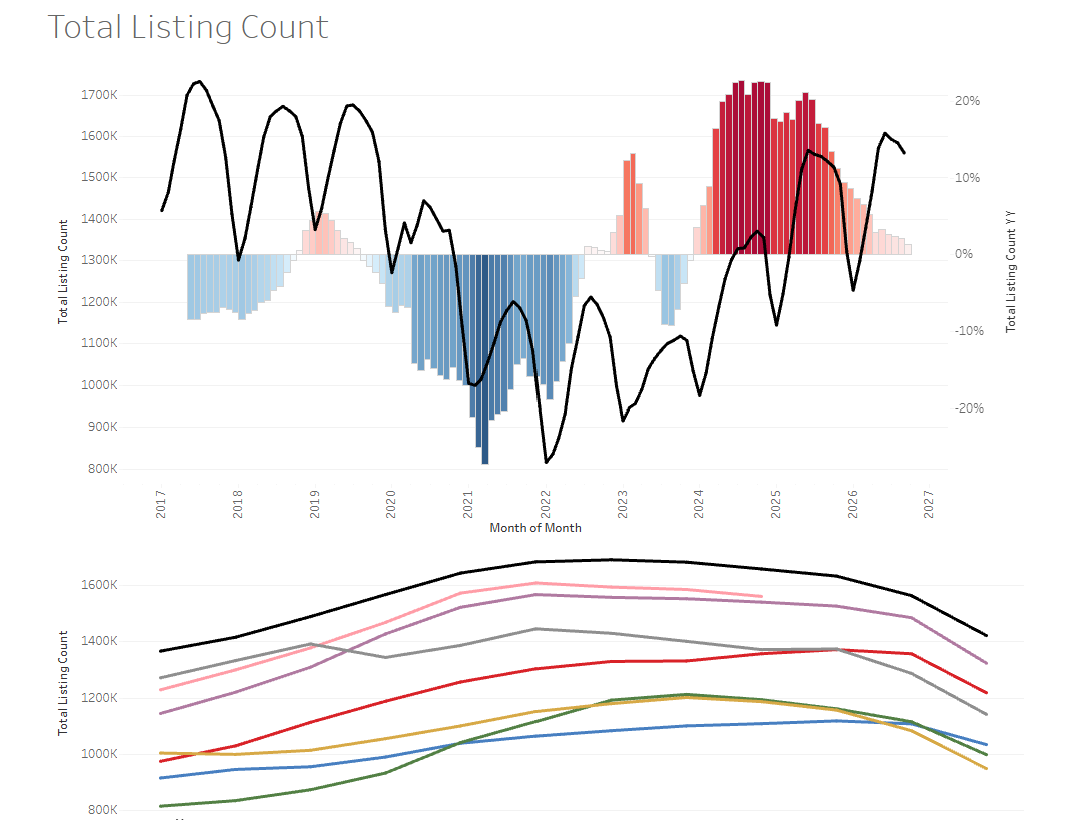
By historical standards, while inventory has increased, it is higher than any COVID year and lower than any pre-COVID year. As long as inventory remains at these levels housing prices CANNOT substantially decrease nationally, and create pressure for more home building.
All real estate markets are locally driven. While there is news nationally, our market is affected by local events and factors. In Los Angeles, our market continues to move slowly towards a balanced market, closing this week at 34, down from last week 35 according to Altos Market Data. This is the closest to balanced the market has been in Los Angeles since before COVID.
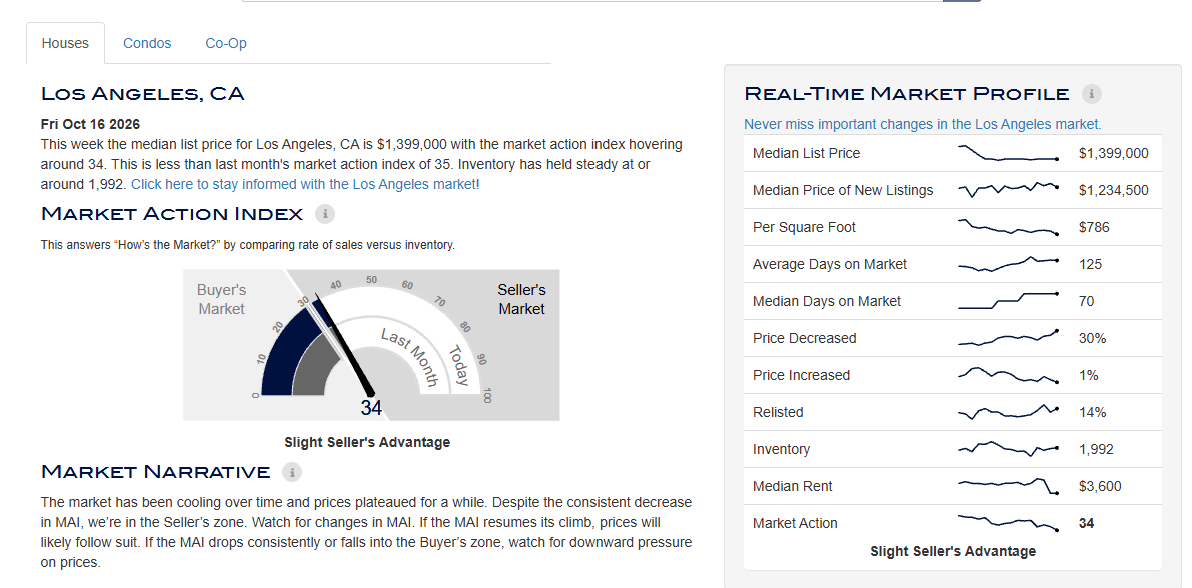
With inventory in Los Angeles growing and price per square foot dropping, this market is finally moving towards a balanced market for buyers just as the interest rates are dropping, making this the best opportunity for buyers in almost a decade.
So, in the news this week…
How do you stand out as a real estate agent in a clouded field? Well, a few criminals in Tennessee found a way to use unused websites to present themselves as a top real estate team.

The criminals were in China, and it is unclear what their end game was, but no one does this unless there is some plan. In a real estate dominated by anonymous global monopolies like Zillow and Redfin, it is more important than ever to work with experts that can help you that you know, like, and trust.
How different are Zillow and Redfin and other websites like Realtor.com and Homes.com? Well, according to a report by the Consumer Policy Center, not much, as most of them have the same information.

They did note that Redfin has a program to agree to hide some of Compass and its affiliated companies listings in exchange for fooling buyers to use their overpriced and poor service lender Rocket, and they also noted that only Realtor.com showed both contingent or active and pending properties that were under contract, which is a rich pool to watch since 15 of those fall out and at that point the seller is generally HIGHLY motivated. Zillow and Redfin don’t show them as they are in the business of selling buyers leads to agents, NOT giving buyers the most information.
So, what should YOU do about buying or selling real estate in today's market?
If you want to move or downsize, it's still a great market to sell, but a bit more challenging than in the last few years.
Finally, if you can find a property that will give you cash flow, this is a great time to get solid cash flow and enjoy the tax benefits of real estate.
How can I help you? Call, text, or email me.
Bill Gross
TheLAProbateExpert.com
(310) 210-0008
bill@thelaprobateexpert.com
Probate & Trust Real Estate Broker, DRE #01022275
Bill Gross, The LA Probate Expert, brokered by eXp Realty, 8383 Wilshire Blvd., Suite 800, Beverly Hills CA 90211